A quick Google search can show you how expensive it is to train your staff. Onboarding alone has an average cost of $1886 per employee. This is before you add in hidden costs as well as the wage that is paid in this period where your employee isn’t working to their full potential. We invest in our workers with the hope that their time and effort will pay off. But each employee is unique in their own way. There is no guarantee that employees will develop in the way that we hope, contributing to the culture of the company, maintaining top standards in their careers or simply remaining in their jobs.
Employers will be all too aware of this. A recent study found that in the USA, millennials change jobs an average of four times in their first decade of working life. For Gen Xers — those born between 1965 and 1980 — one or two job changes during the same period has been shown to be more likely. It is costly to train and develop new workers. Retaining employees can save significant amounts of money for employers but the trick is understanding why they are leaving in the first place.

Millennials change jobs far more often than their parents did during the first 10 years of working life.
In order to showcase how an enterprise company could reduce employee turnover, our team grabbed a dataset containing information about IBM employees alongside a variable detailing whether the employee has left or remained in their jobs. Then, we set out to build a clustering model in order to discover sub-communities within the group of employees that left their jobs.
Our team wanted to uncover the different reasons why groups of employees left their jobs.
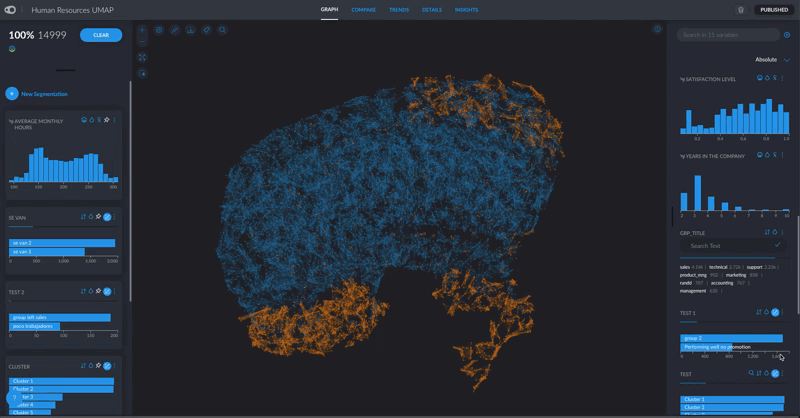
First, we uploaded the data to Graphext, a browser-based tool allowing people to conduct complex analytics without writing any code. Then, we built a project clustering employees using their characteristics as factors and the field specifying whether they remained in the company as the target variable. We found 3 distinct clusters of employees that left their jobs, each with different motivating factors.
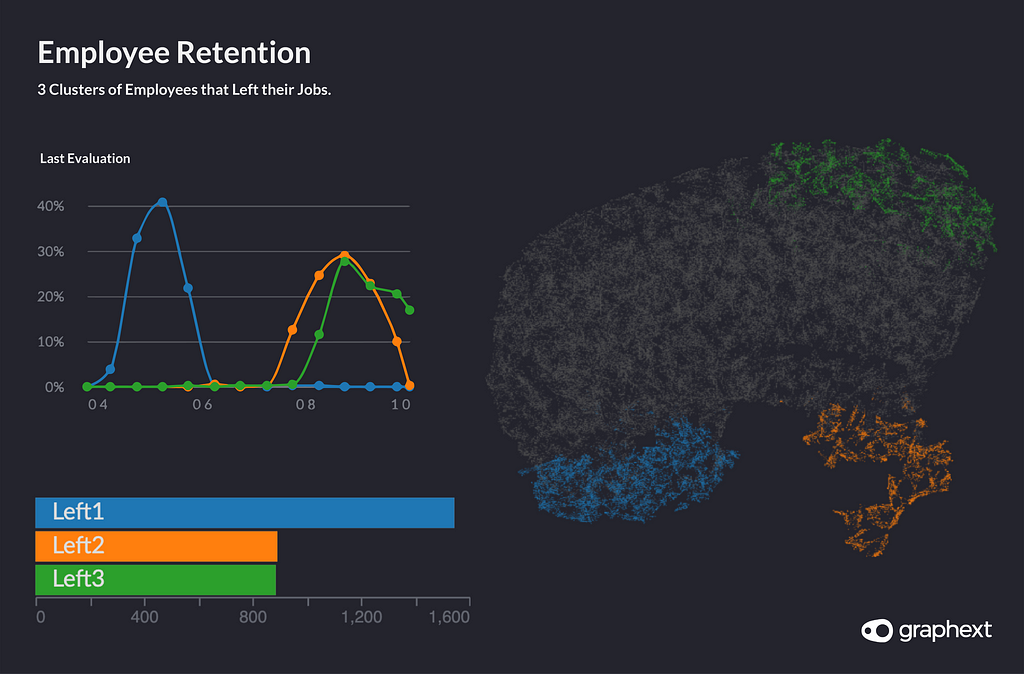
From the perspective of a HR department, the primary aim would be to reduce the number of high performing employees that left the company. We used Graphext’s compare panel to distinguish which clusters featured employees with the highest scores for their previous evaluation and identified that we should focus on the green and orange clusters.
Similarities between employees in the green and orange clusters show that, despite strong evaluations and having worked in the company for 5 years, they are very unlikely to have been promoted.
Trending Bot Articles:
2. Automated vs Live Chats: What will the Future of Customer Service Look Like?
4. Chatbot Vs. Intelligent Virtual Assistant — What’s the difference & Why Care?
Employees in the green and orange clusters were good at their jobs but received low salaries and were not often promoted.
Using this finding, our team formed a hypothesis that the IBM HR department would be better offering a more competitive salary plan for these people if they wanted to keep their high performing employees. Without fully understanding more about the difference between these two communities, we could already assume that a lack of promotions and a low salary will increase the risk that people will leave your company.
Our team then used Graphext’s compare panel to uncover the defining differences between these two clusters. Satisfaction level was a significant variable here, with employees in the orange cluster seemingly sharing a low satisfaction level whilst employees in the green cluster enjoyed more job satisfaction.

Setting out to investigate why satisfaction level varied so greatly between the two clusters, our team found that employees in the orange cluster worked the most of all employees in the dataset (on average 250–300 hours every month). Although employees in the green cluster worked a lot, their monthly hours were more moderately balanced against the rest of the dataset. These findings led us to another hypothesis; that employees in the orange cluster leave IBM because they work a lot, don’t get promoted and receive low salaries.
Now, our team turned their attention to the green cluster, attempting to uncover the factors motivating these employees to leave their jobs. Employees in this community work only slightly less but are much happier. They seem to be able to handle stress as they still work on a number of projects but don’t have to work as much each month to do so. It’s possible that they are more efficient.
As we dove deeper into our analysis of this cluster, it became apparent that the majority of staff in this cluster are in sales. Since they are efficient workers and, as salespeople, should have strong business acumen, our team supposed that a potential workaround to prevent these employees from leaving their positions might involve moving them into management positions. Using this type of analytics, employers could identify candidates worthy of management consideration each year, guaranteeing that only hard-working, satisfied and loyal staff members were promoted and at the same time, reducing employee churn and recruitment costs.
Our team went on to develop a prediction model in order to further understand which factors were motivating employees to leave their jobs. Read more about it in this guide that we wrote on the topic: https://www.graphext.com/docs/predicting-employee-behaviour
If you want to try it for your employees, you can create a free account here: https://accounts.graphext.com/users/sign_up
Don’t forget to give us your 👏 !


How Data Can Help You Keep Your Workers was originally published in Chatbots Life on Medium, where people are continuing the conversation by highlighting and responding to this story.