When I was a young student and short on cash one Summer, I got a job with a lesser-known comparison line. My job was to take phone calls from the irate British public and convince them to change their telecoms package. You would think that this would be difficult, especially as they were normally coming from your main brand providers and all my company had to offer were companies that, up until that stage, I had never heard of, nor the customer. Well, it turns out that it wasn’t, when people want to leave a company, they really just want to leave.
What surprised me though was that most of the callers had been with their provider for a long time and up until this stage had been happy with their service. And, their reasons for leaving were normally easily fixable on the part of the provider. Now if you consider that I was working for a much smaller competitor (really — much smaller), this makes you wonder, how many customers are these guys actually losing each year? And from their perspective, how can they prevent it from happening?
When people want to leave a company, they really just want to leave.

Lost customers are called “churn”. It is difficult to go into a strategy meeting without hearing the word. No matter how great your sales team is, how captivating your product, your business model is failing if you don’t keep on top of your churn. Clients leave for a multitude of reasons, some are unavoidable (especially with the current COVID situation) but identifying the customer’s motivation for leaving allows you to predict and prevent churn.
With my job at the comparison line, most people complained to me about long wait times and bad customer service. If this had been recognised and measures such as extra team members at busy times and additional customer service training put in place then the company could have saved millions in churn. So how can you identify these factors as early as possible?
Trending Bot Articles:
2. Automated vs Live Chats: What will the Future of Customer Service Look Like?
4. Chatbot Vs. Intelligent Virtual Assistant — What’s the difference & Why Care?
Our team looked to create a project analysing 7043 current and former customers of a telecoms provider in order to better understand what types of people are most likely to cancel their contracts.
With the intention of showing how this might be done (and easily reproduced) our team looked to create a project analysing 7043 current and former customers of a telecoms provider in order to better understand what types of people are most likely to cancel their contracts. On top of this, we also wanted to know whether there is anything the telecoms provider could do to motivate their customers to stay.
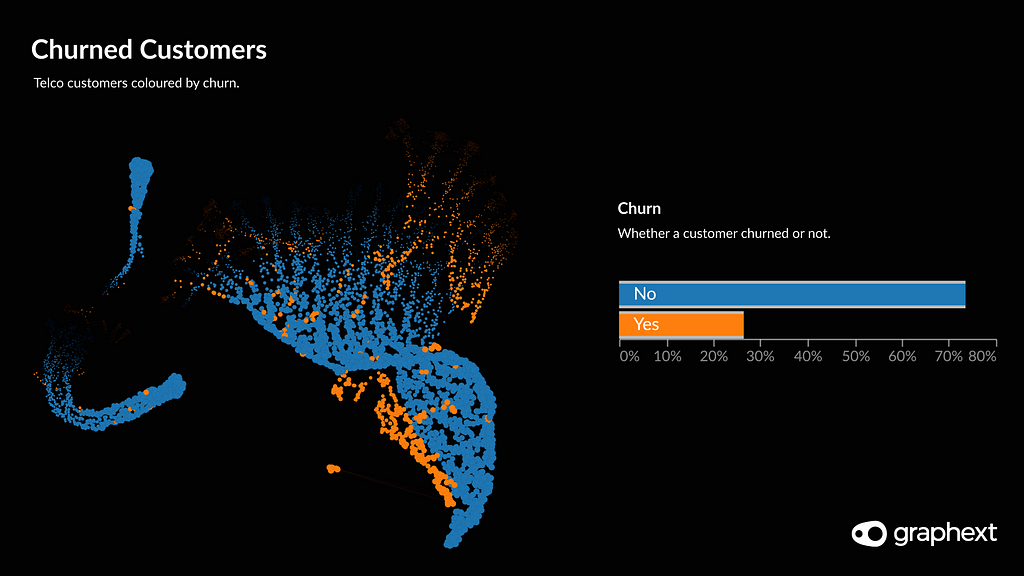
We found a dataset from Kaggle containing 26 variables including the customer’s type of internet service, whether they had churned or not and their monthly charges. We used these variables as factors to create a clustering model using Graphext — a platform for conducting complex data analytics without writing any code.
At this stage, our goal was simply to see the churned customers and to understand them better, so we coloured the graph and filtered it so that we only had the data points for the customers that had left. Then, we used the Graph to zoom in on the 4 communities of churned customers in the dataset in order to further discover the characteristics of these customers.
Cluster 1
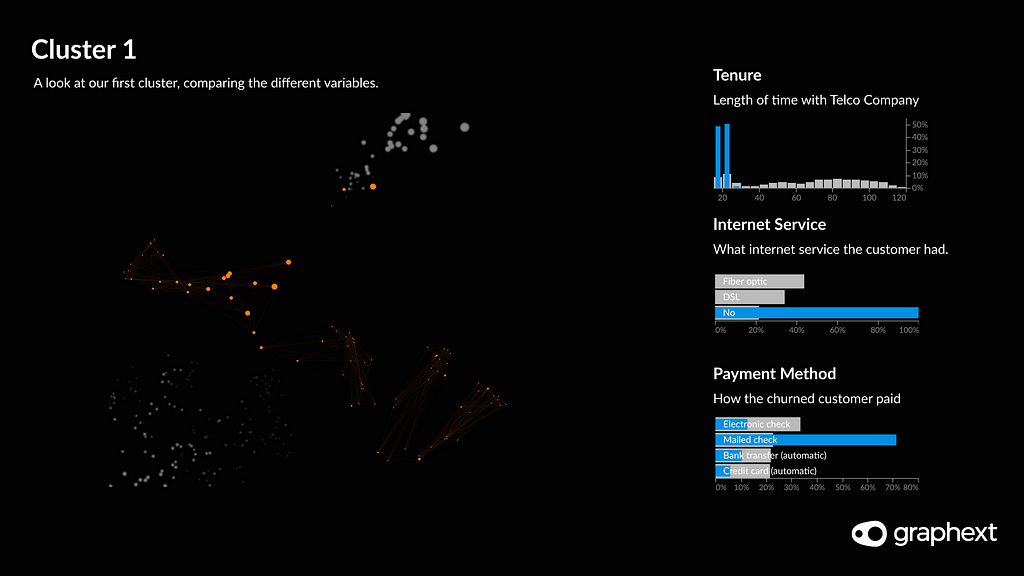
Cluster 1 stands out as it is an outlier in the graph and includes only a very small minority of customers. This group were only using a phone line and weren’t paying for internet or TV. They had a low tenure, or to put it more precisely, they had been in the company for only a short period of time. Looking closely at the characteristics of this group, they seem to reject any firm ties to the company. They were on a month-to-month contract, they pay by cheque and their monthly billings are very low.
Cluster 2
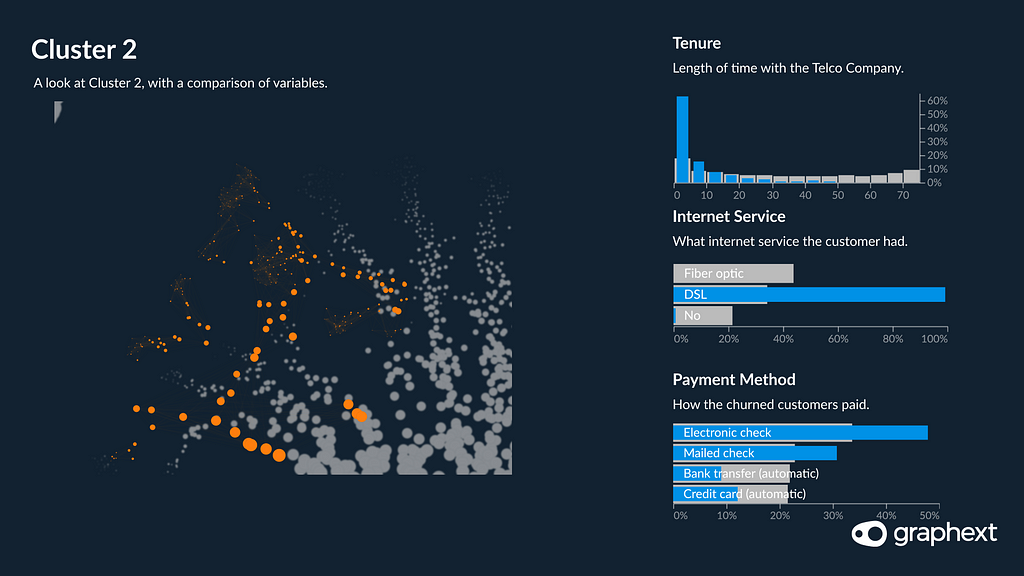
Cluster 2 has a little bit more going on and at the very least they have broadband at home. It’s DSL though — if you remember those days. They are equally paying by monthly cheque and they also don’t have any TV packages. Once again we find that these churned clients are on a month-to-month contract and only stayed with the company for a short period of time. Moreover, they opted out of tech support in their package.
Cluster 3
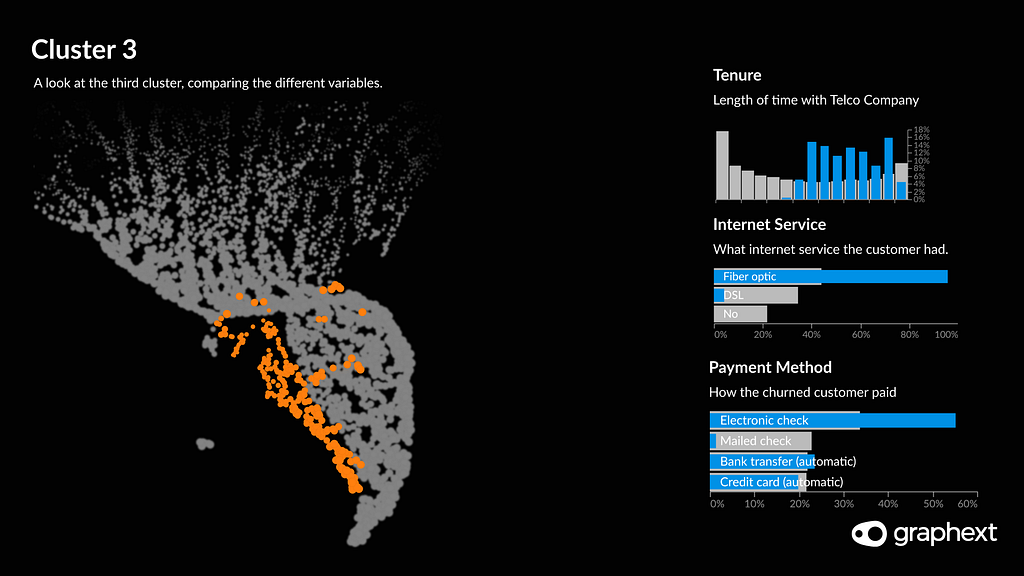
Cluster 3. We are beginning to see some patterns emerging. These customers are our first cluster with fibre optic but once again we see that the majority are paying by monthly cheque and are mainly on a month-to-month contract, and still no tech support. These customers have been with the company for longer.
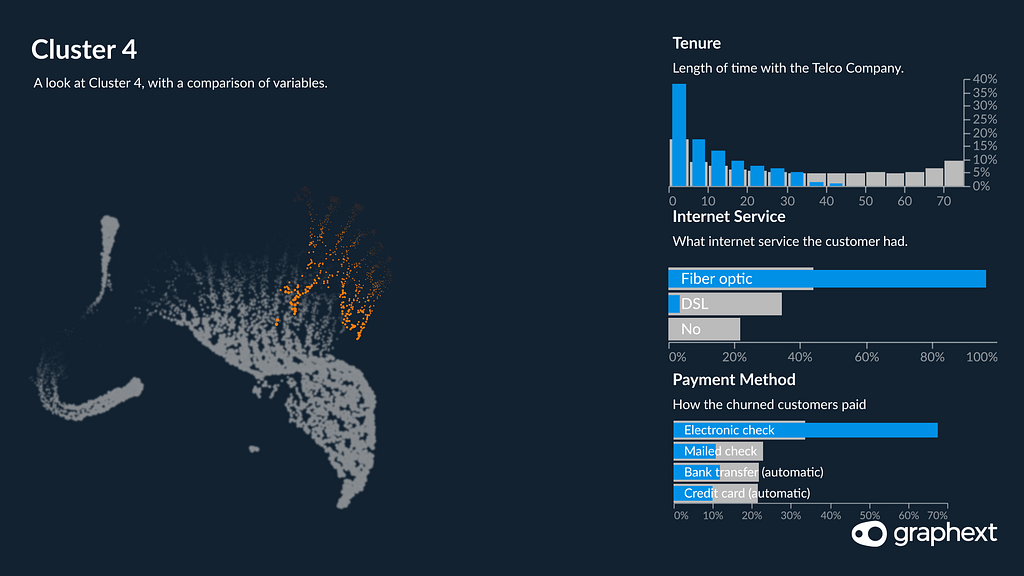
Cluster 4
Cluster 4. Our youngest cluster seems to have a better package with TV streaming and monthly spending a bit higher. However, we still see them without tech support, month-to-month contracts and once again, paying monthly by check. Furthermore, they churned quickly having spent a relatively short amount of time with the provider.
All this clearly indicates that the three characteristics common to all of our churned clusters are; paying by check, month-to-month contracts and no tech support. Once these are identified it is much easier to gather solutions that could help you retain these customers. Despite the fact that there are communities of customers that didn’t churn also possessing these characteristics, the prevalence of these features inside churned communities is significant.
Once you identify why customers are leaving you, it is much easier to take appropriate action.
I have since moved on from my job with the comparison line but still, this analysis exposes clearly ways to mitigate this volume of churn no matter which sector you are working in. Taking into account the reasons these customers abandoned their contracts, the company could start offering add-ons to directly combat the movement of these customers away from their business.
Offers such as free tech support in the first year, discounts for direct debit payments and strategies such as up-selling those month-to-month customers and getting them on year-on-year rolling contracts with exit fees would be relevant and informed action that the company could take.
Understanding churn is a crucial method of stopping money from draining out of your business. It seems counter-productive to spend time developing new campaigns and targeting emerging markets when you can’t keep the customers that you already have. This kind of trend is cyclical and downward. It needs attention and action. Analysis tools like Graphext allow you to quickly find where your strategy is leaking and identify the appropriate tools to plug those holes. This kind of analysis is no longer as hard as it once was and can make the difference between red and black accounts.
Don’t forget to give us your 👏 !


Preventing Customer Churn with the Right Kind of Data Analysis was originally published in Chatbots Life on Medium, where people are continuing the conversation by highlighting and responding to this story.